Contour Lines Studio

Give your data some elevation.

Paris --:-- EN · FR bilingual Your local time --:--

Information design & data storytelling studio based in Paris

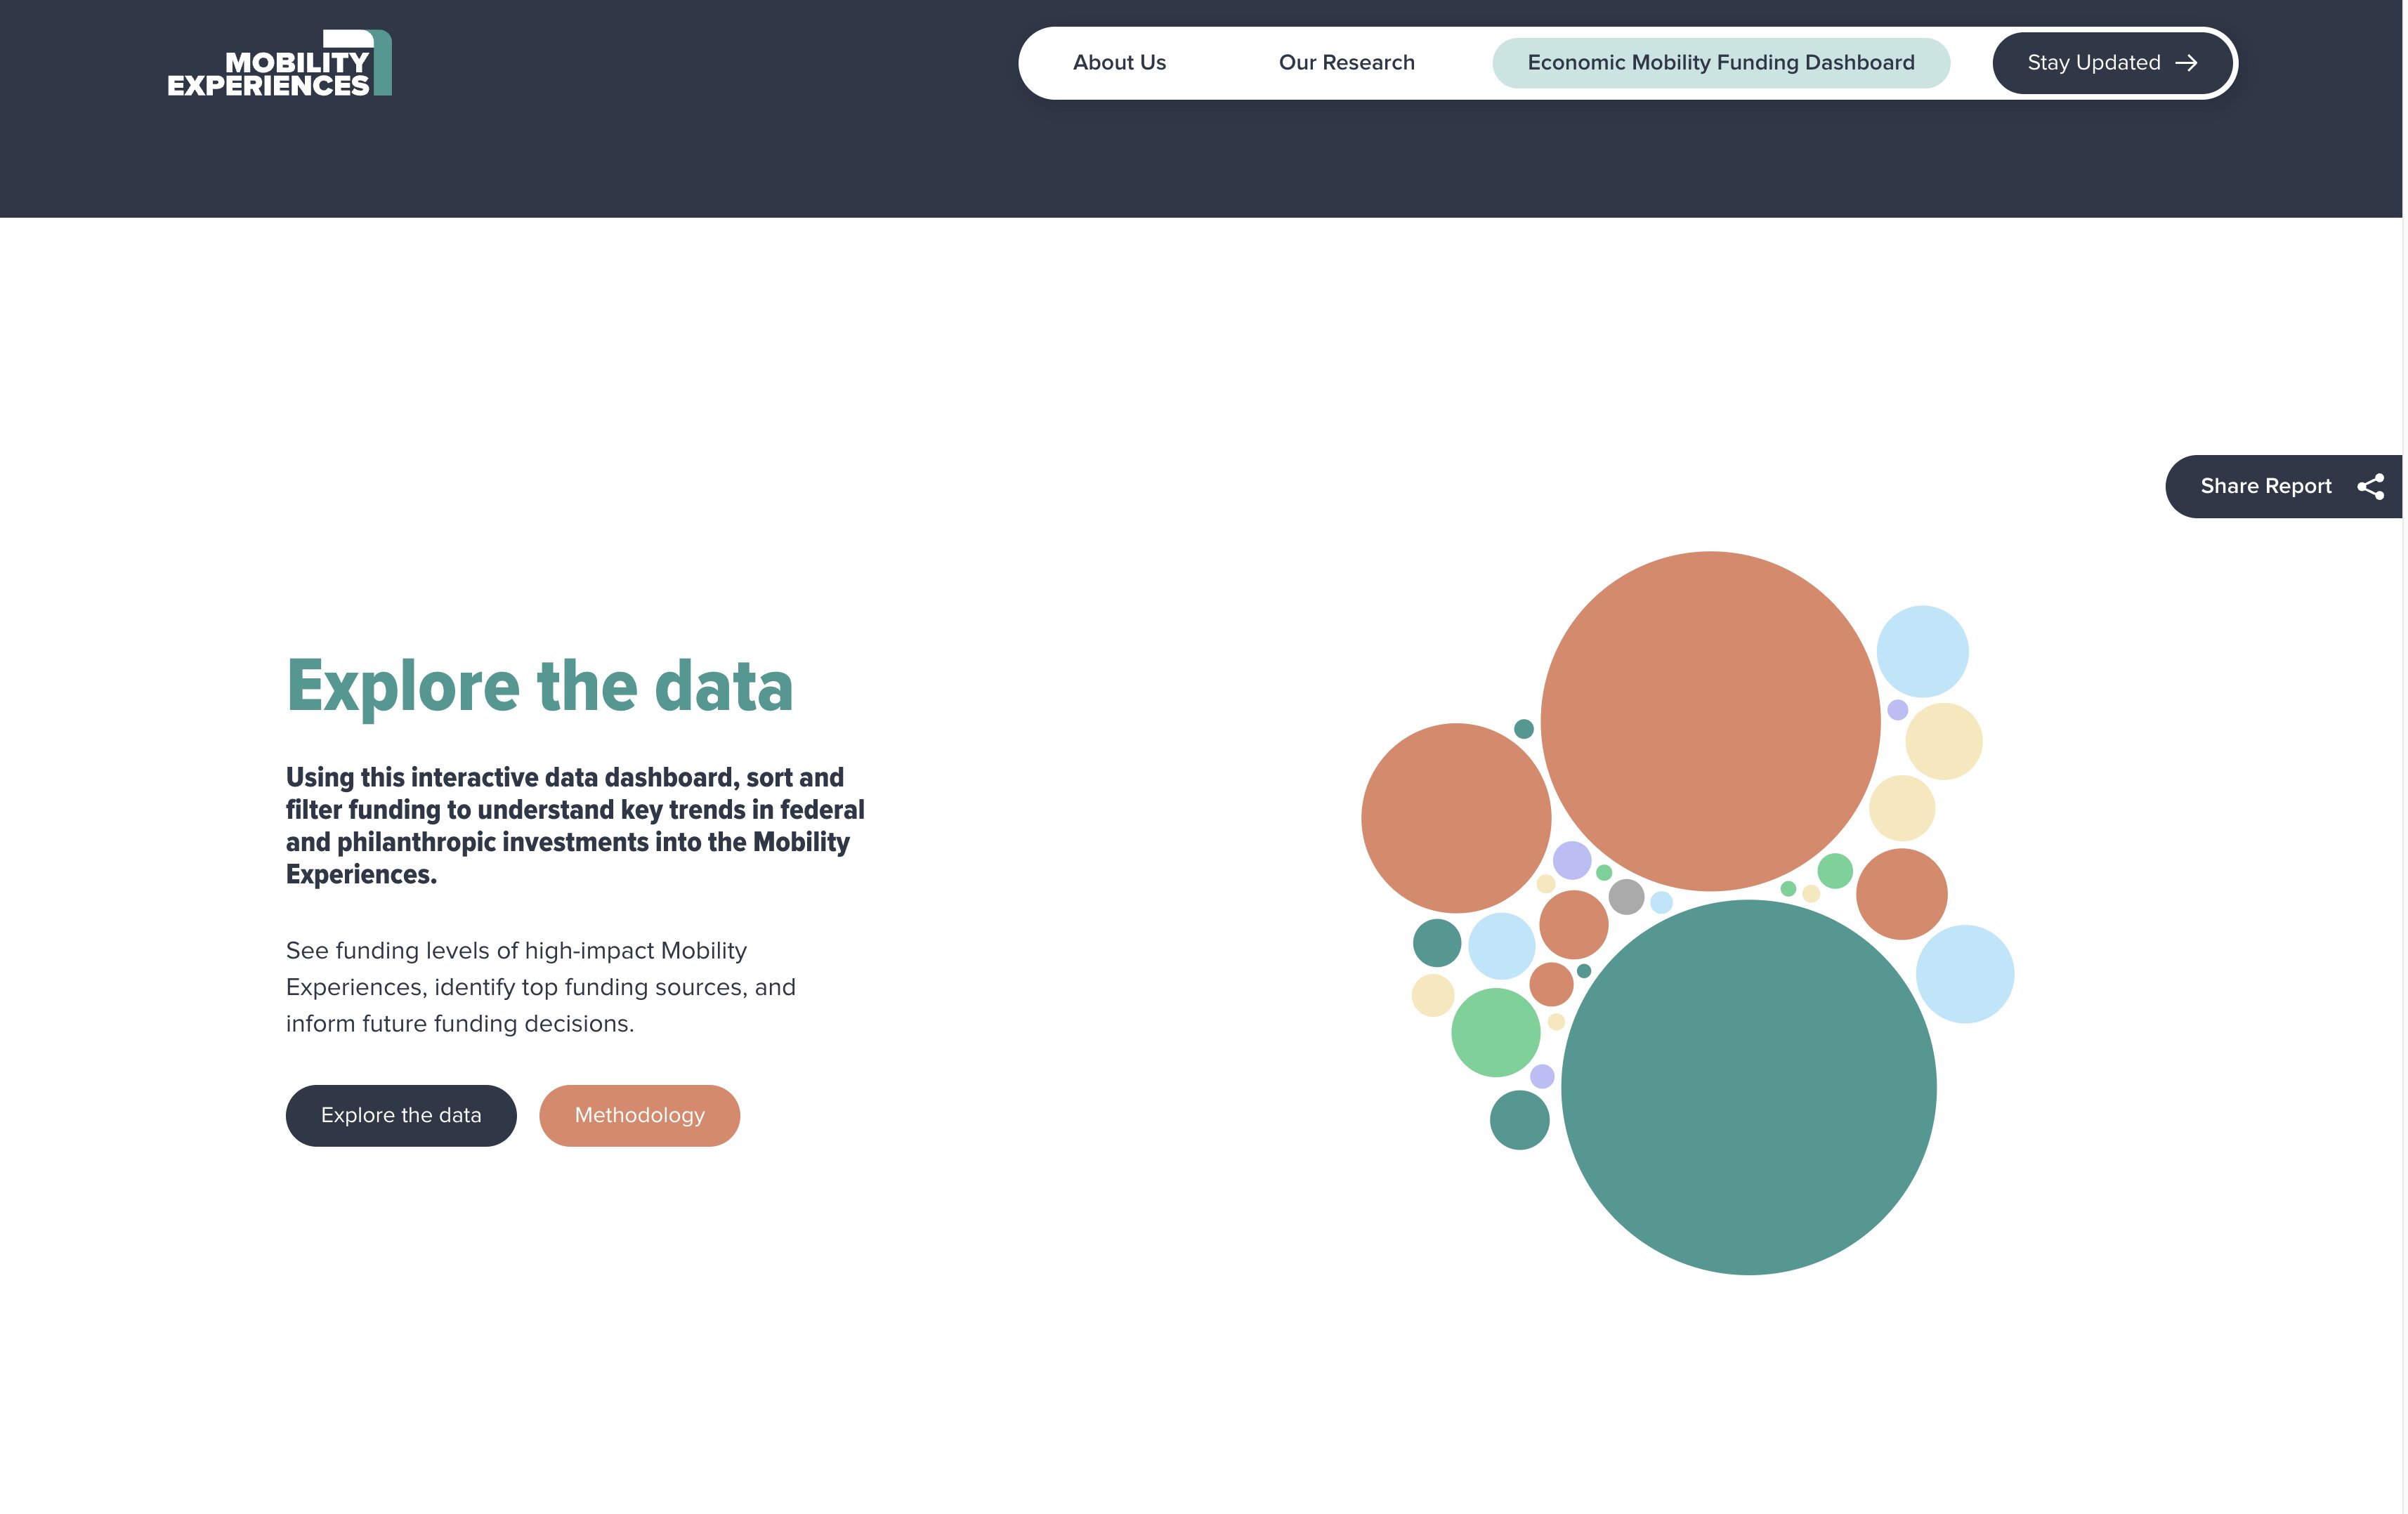
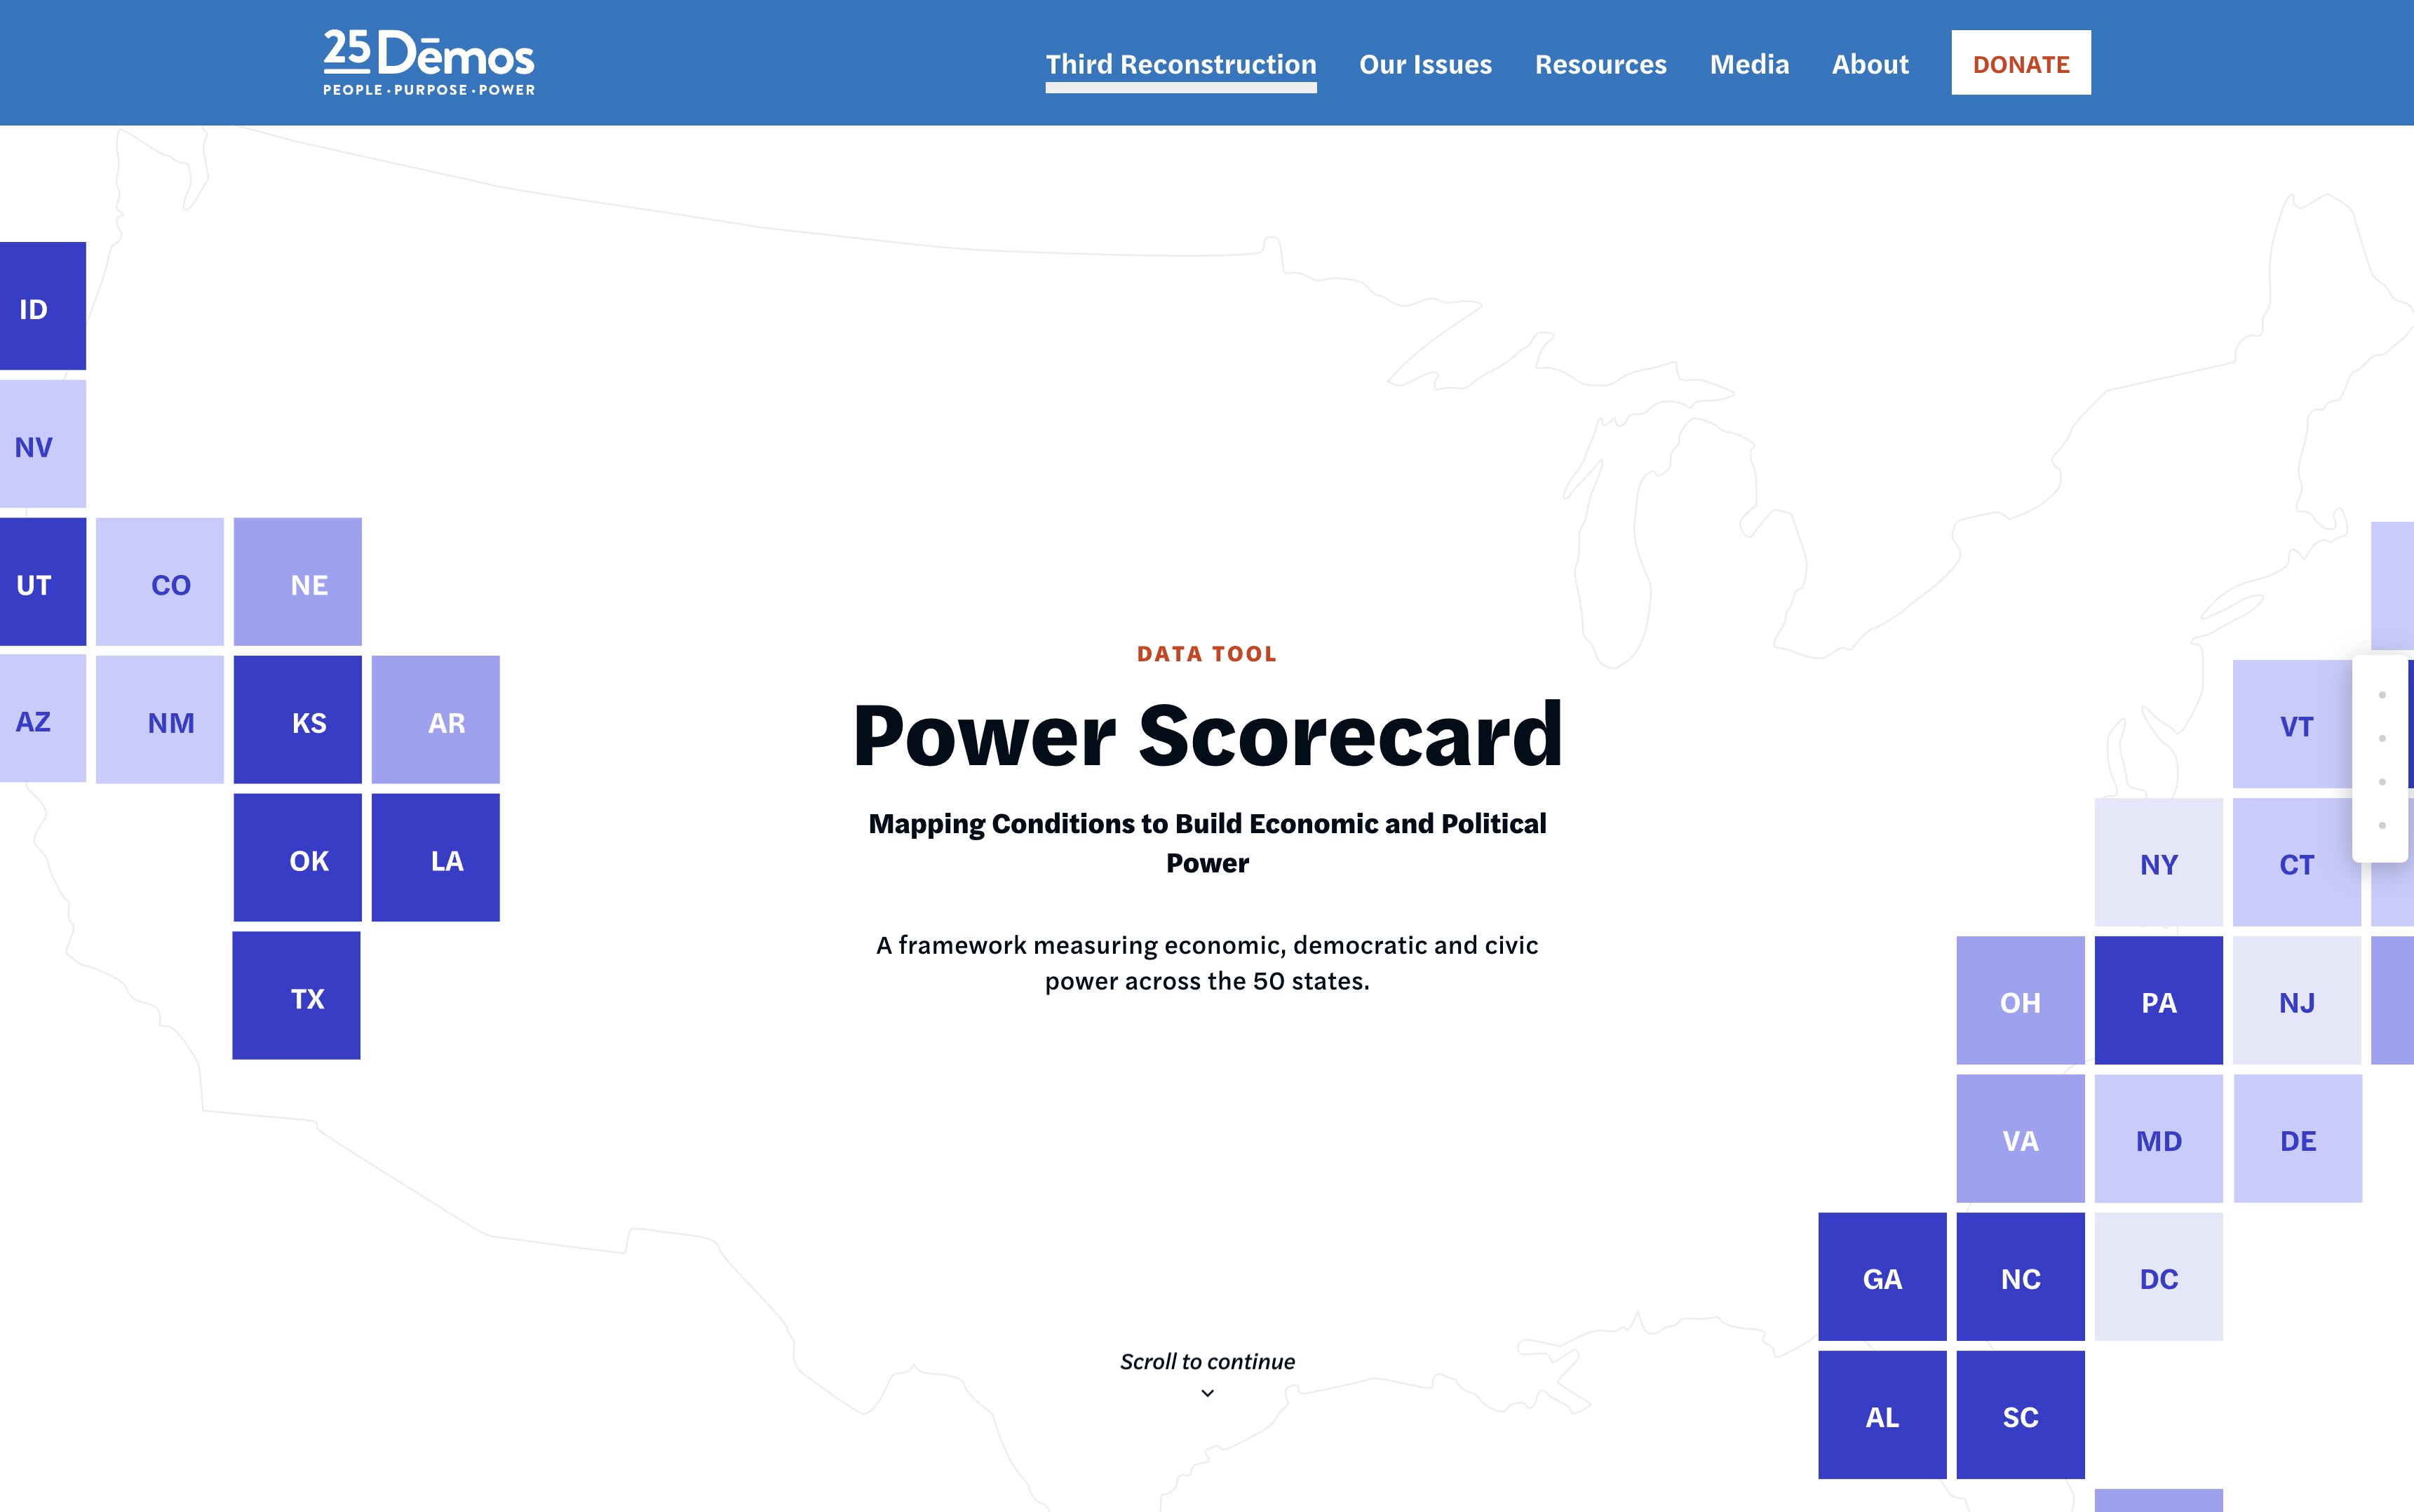
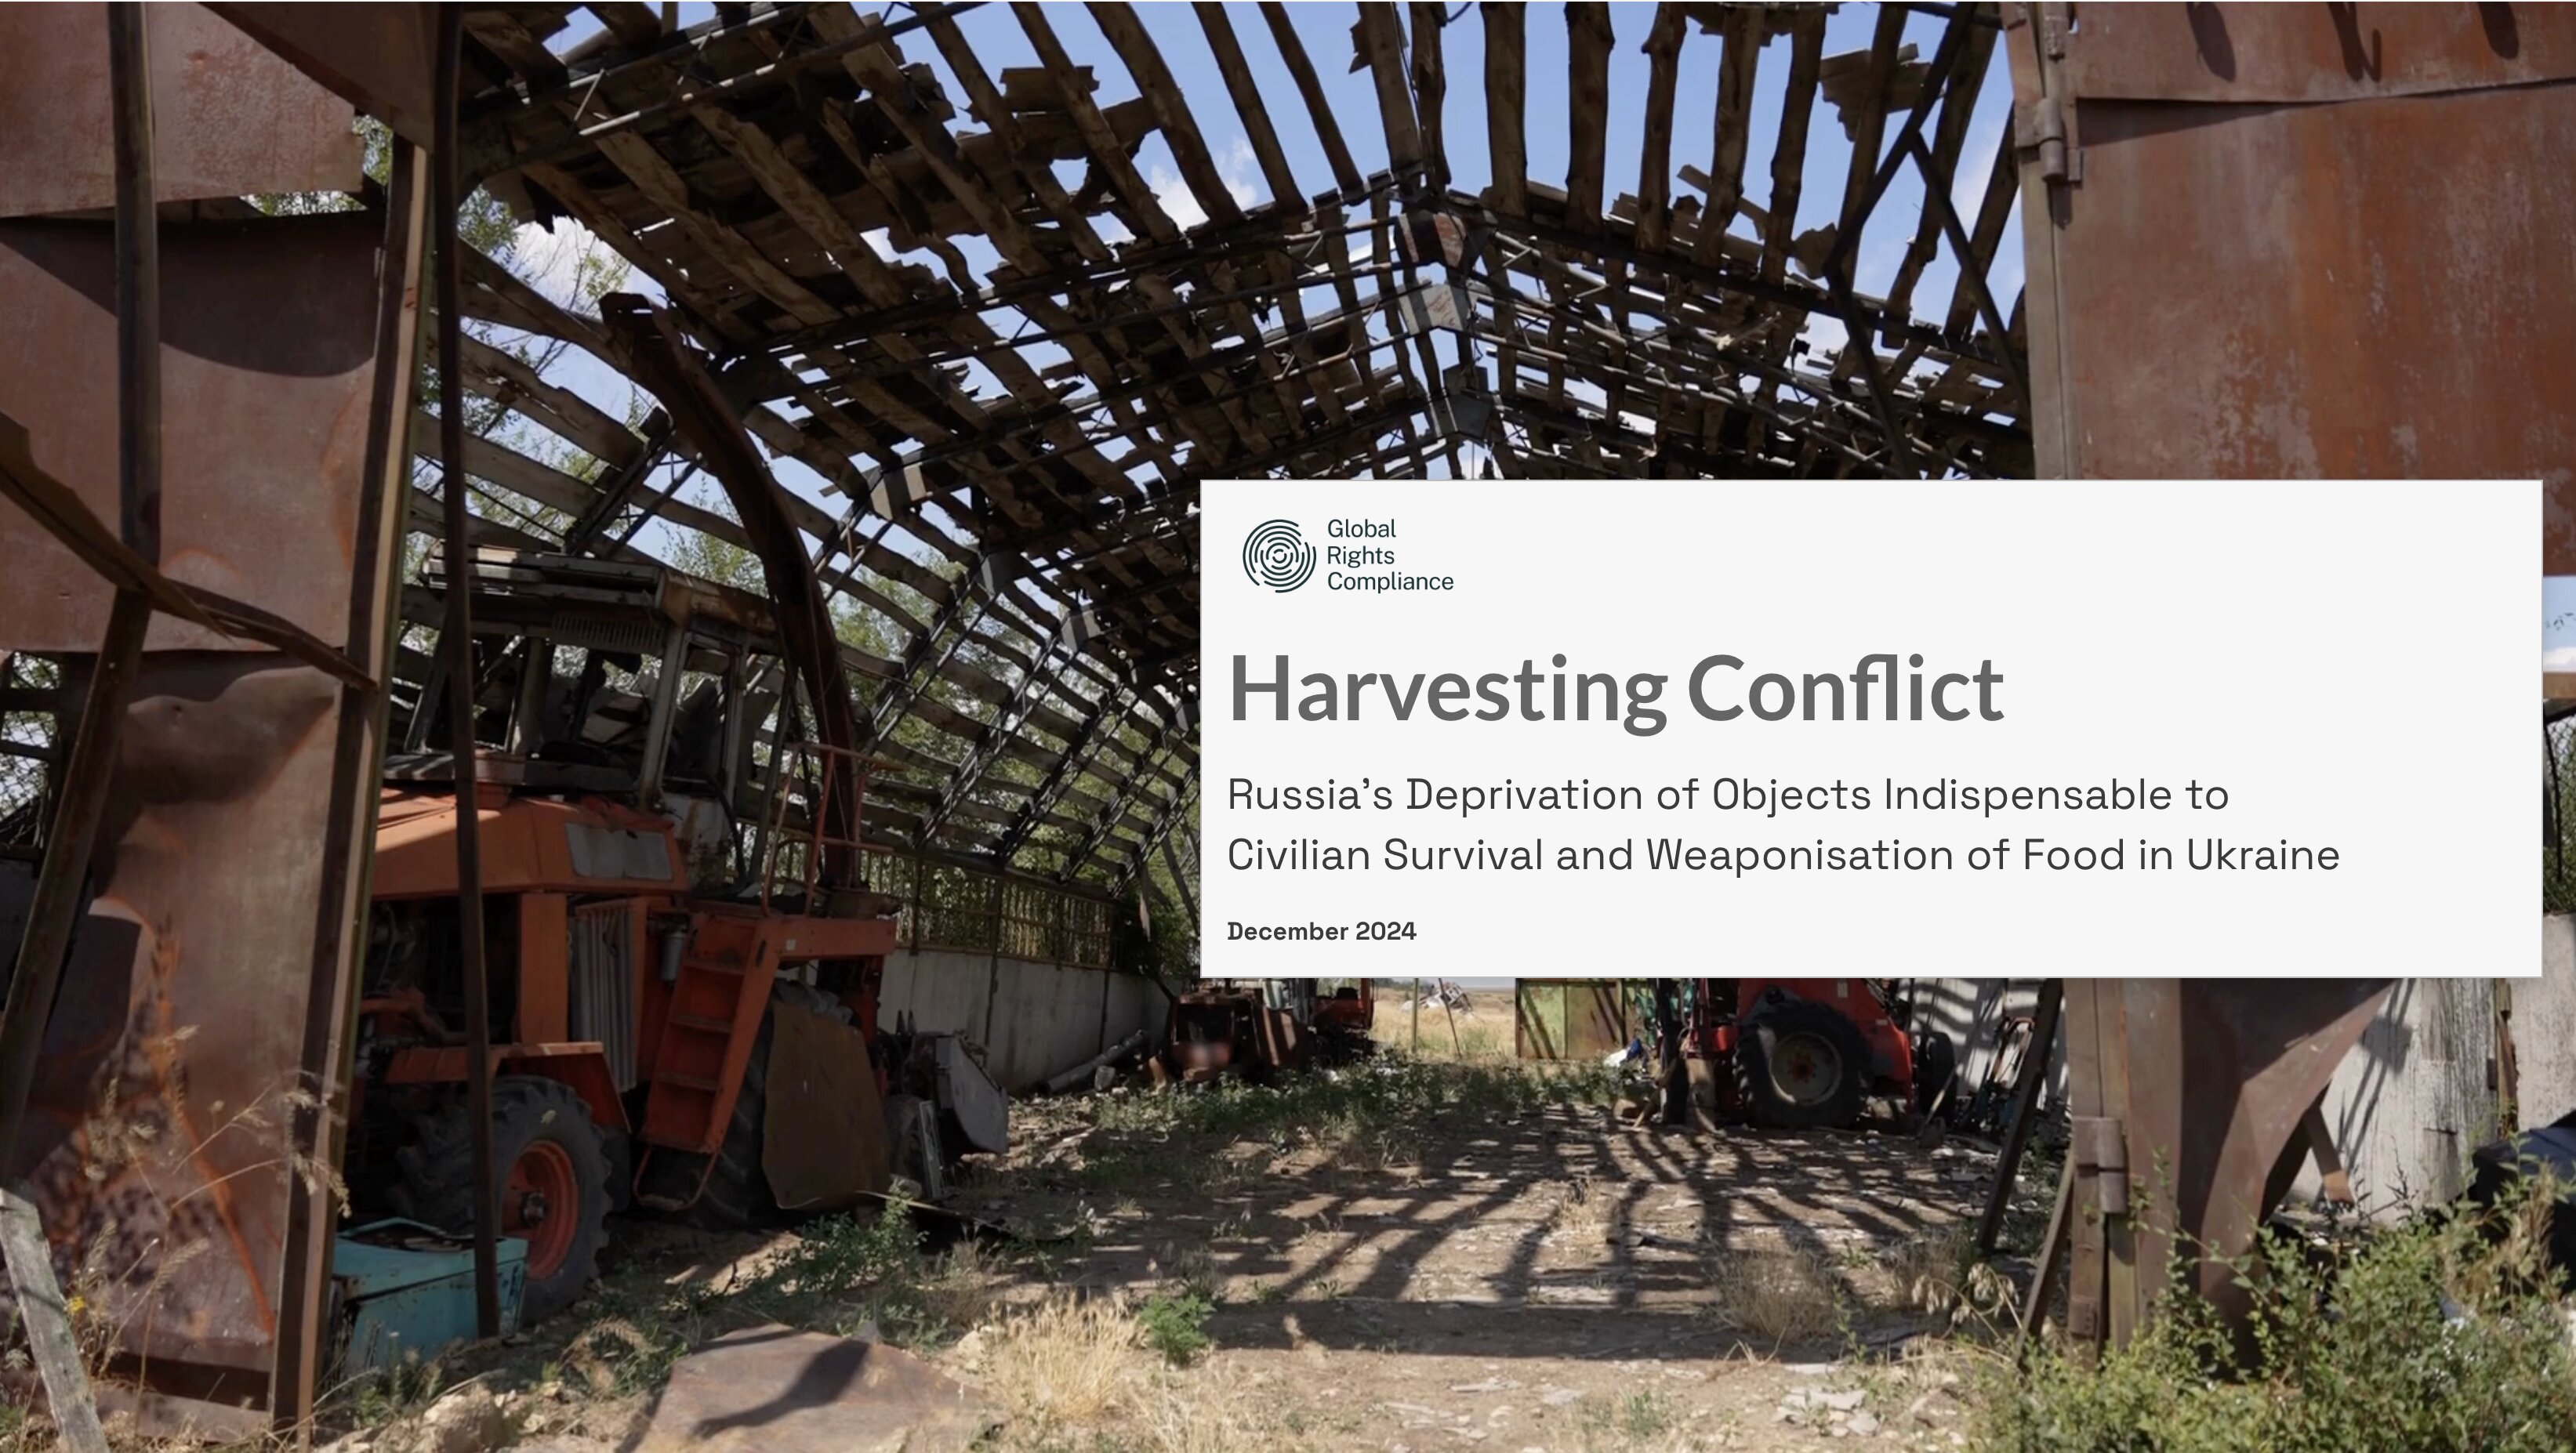
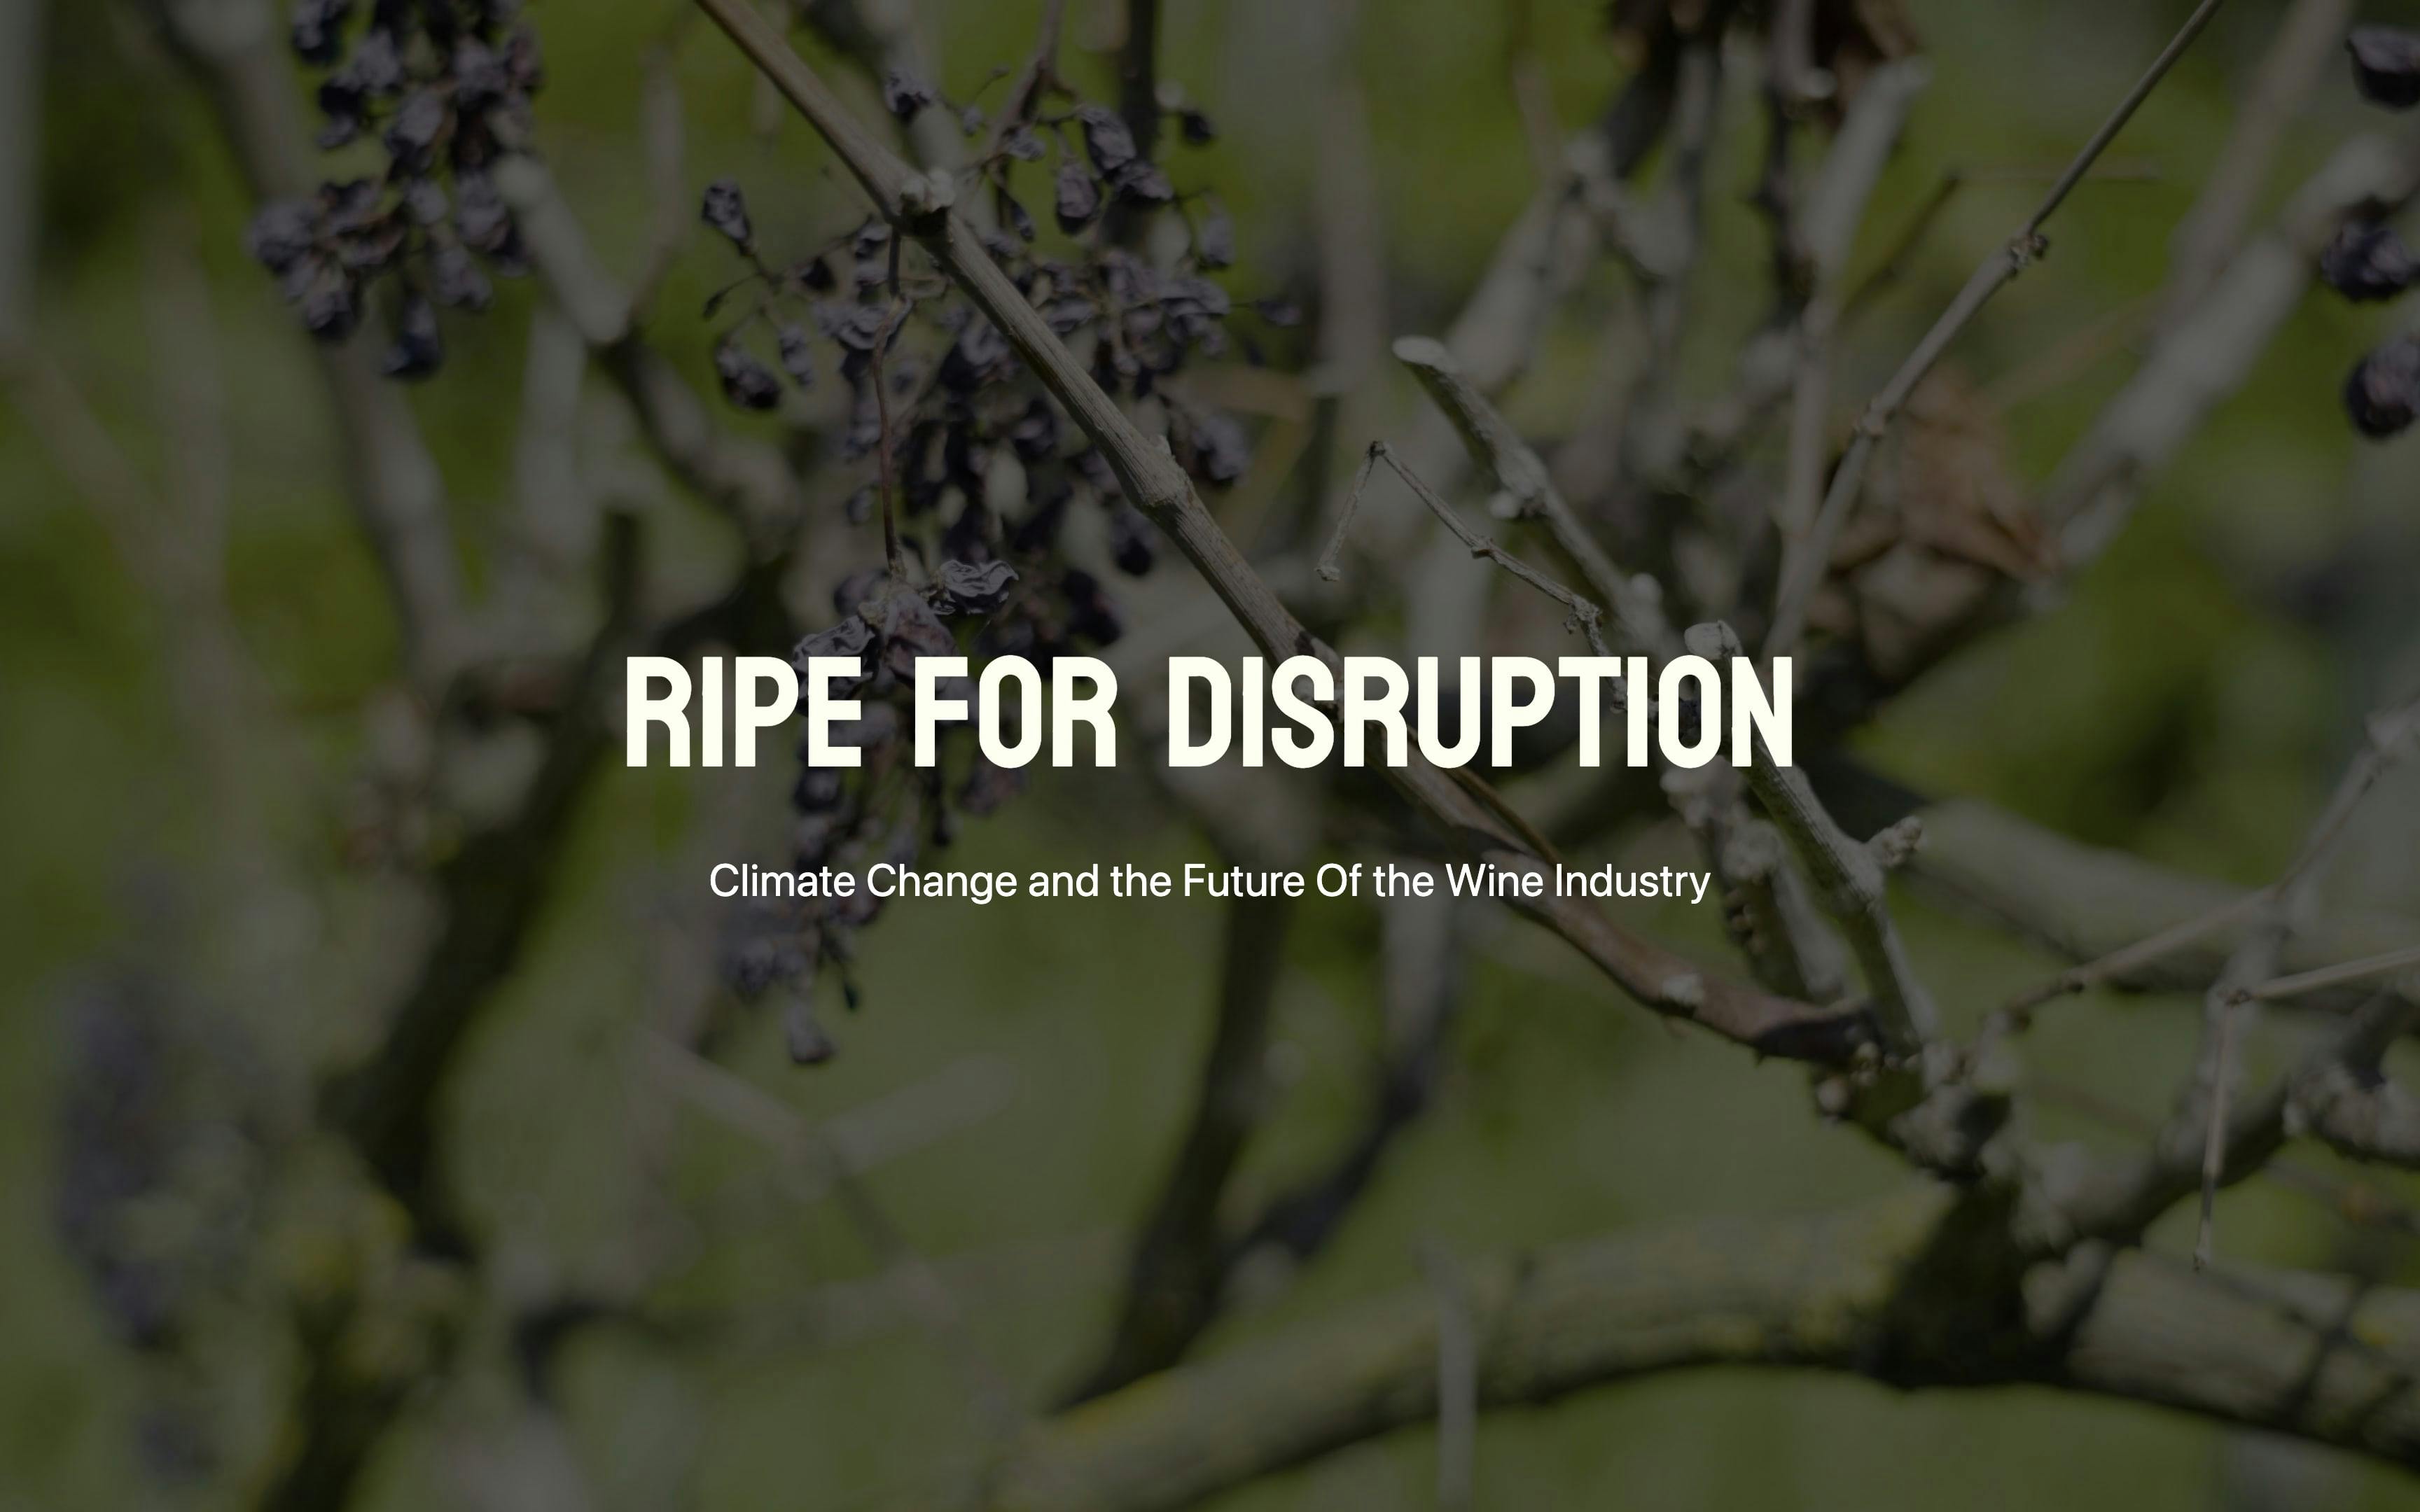
Contour Lines partners with climate adaptation institutions, research centers and foundations, and mission-driven companies to transform high-stakes data into visual narratives that move people to act.

Selected work

Our services

Every engagement starts with one question: what does your audience need to walk away knowing? The format follows from there. (hover a card)

Data Stories

Turn a dense report into something people actually read. Scrollytelling and immersive narratives paced for a real audience, not a meeting.

ScrollytellingLongformMicrosites

Maps & Spatial Intelligence

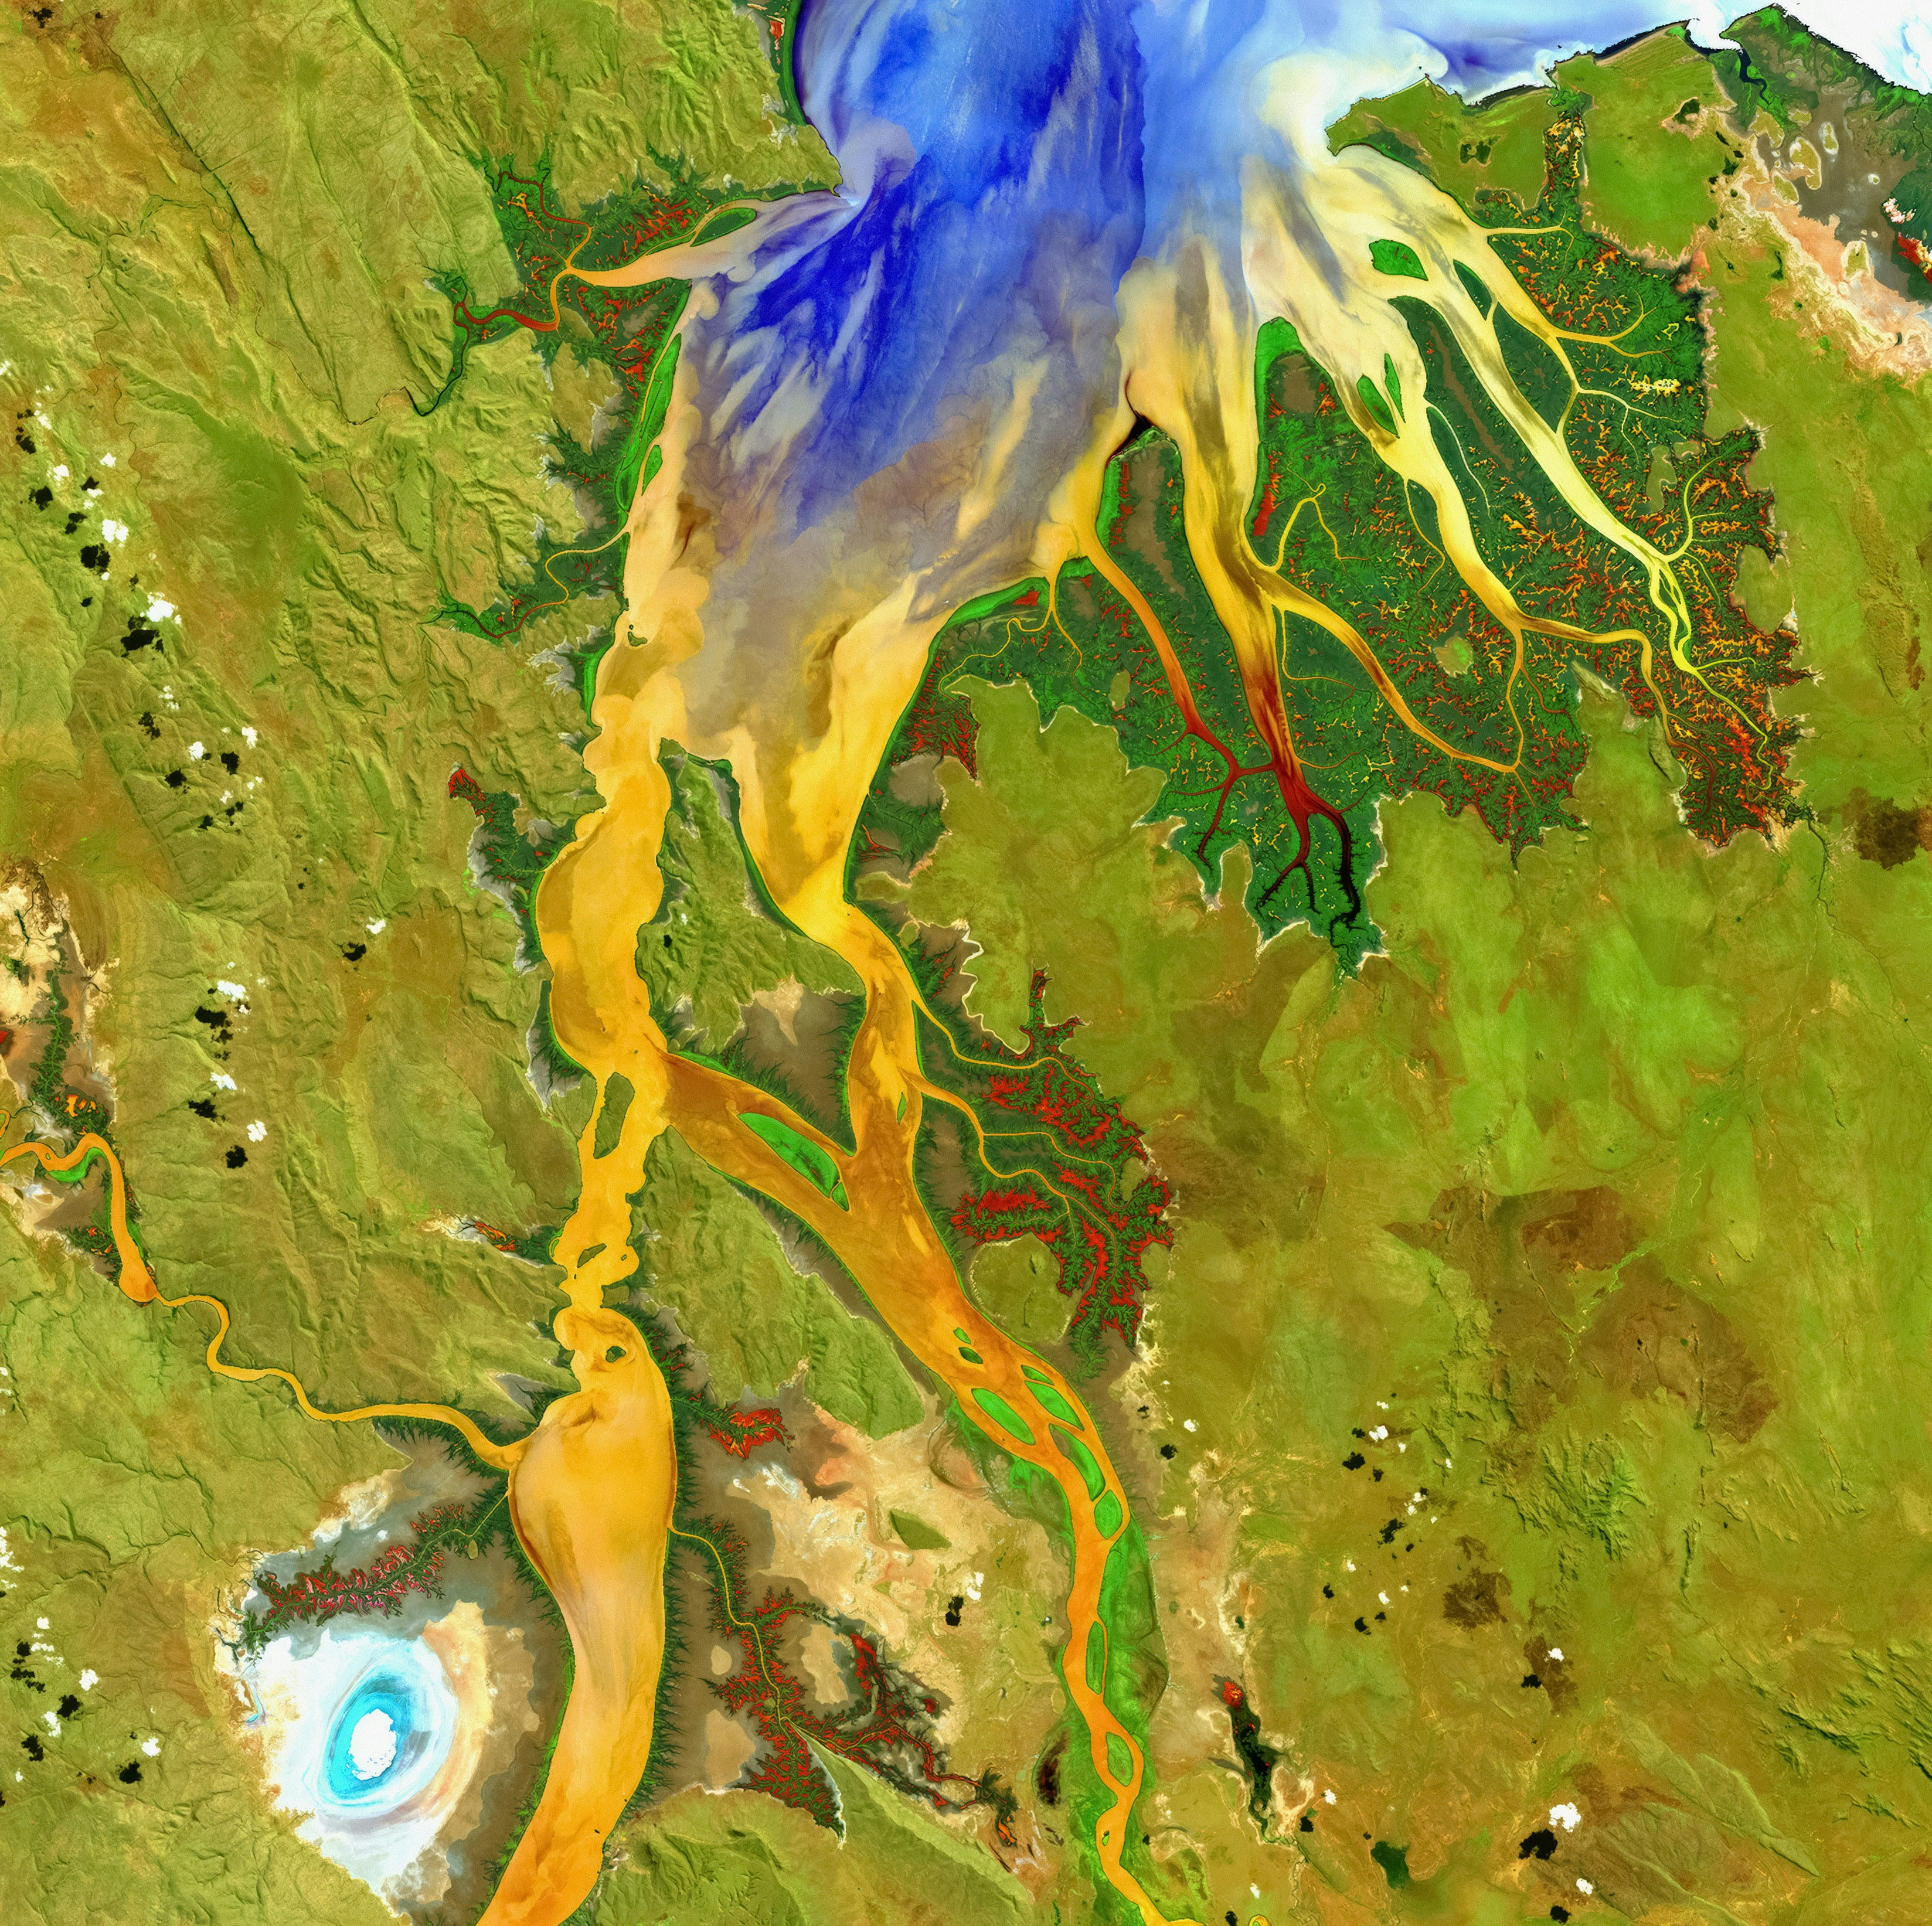
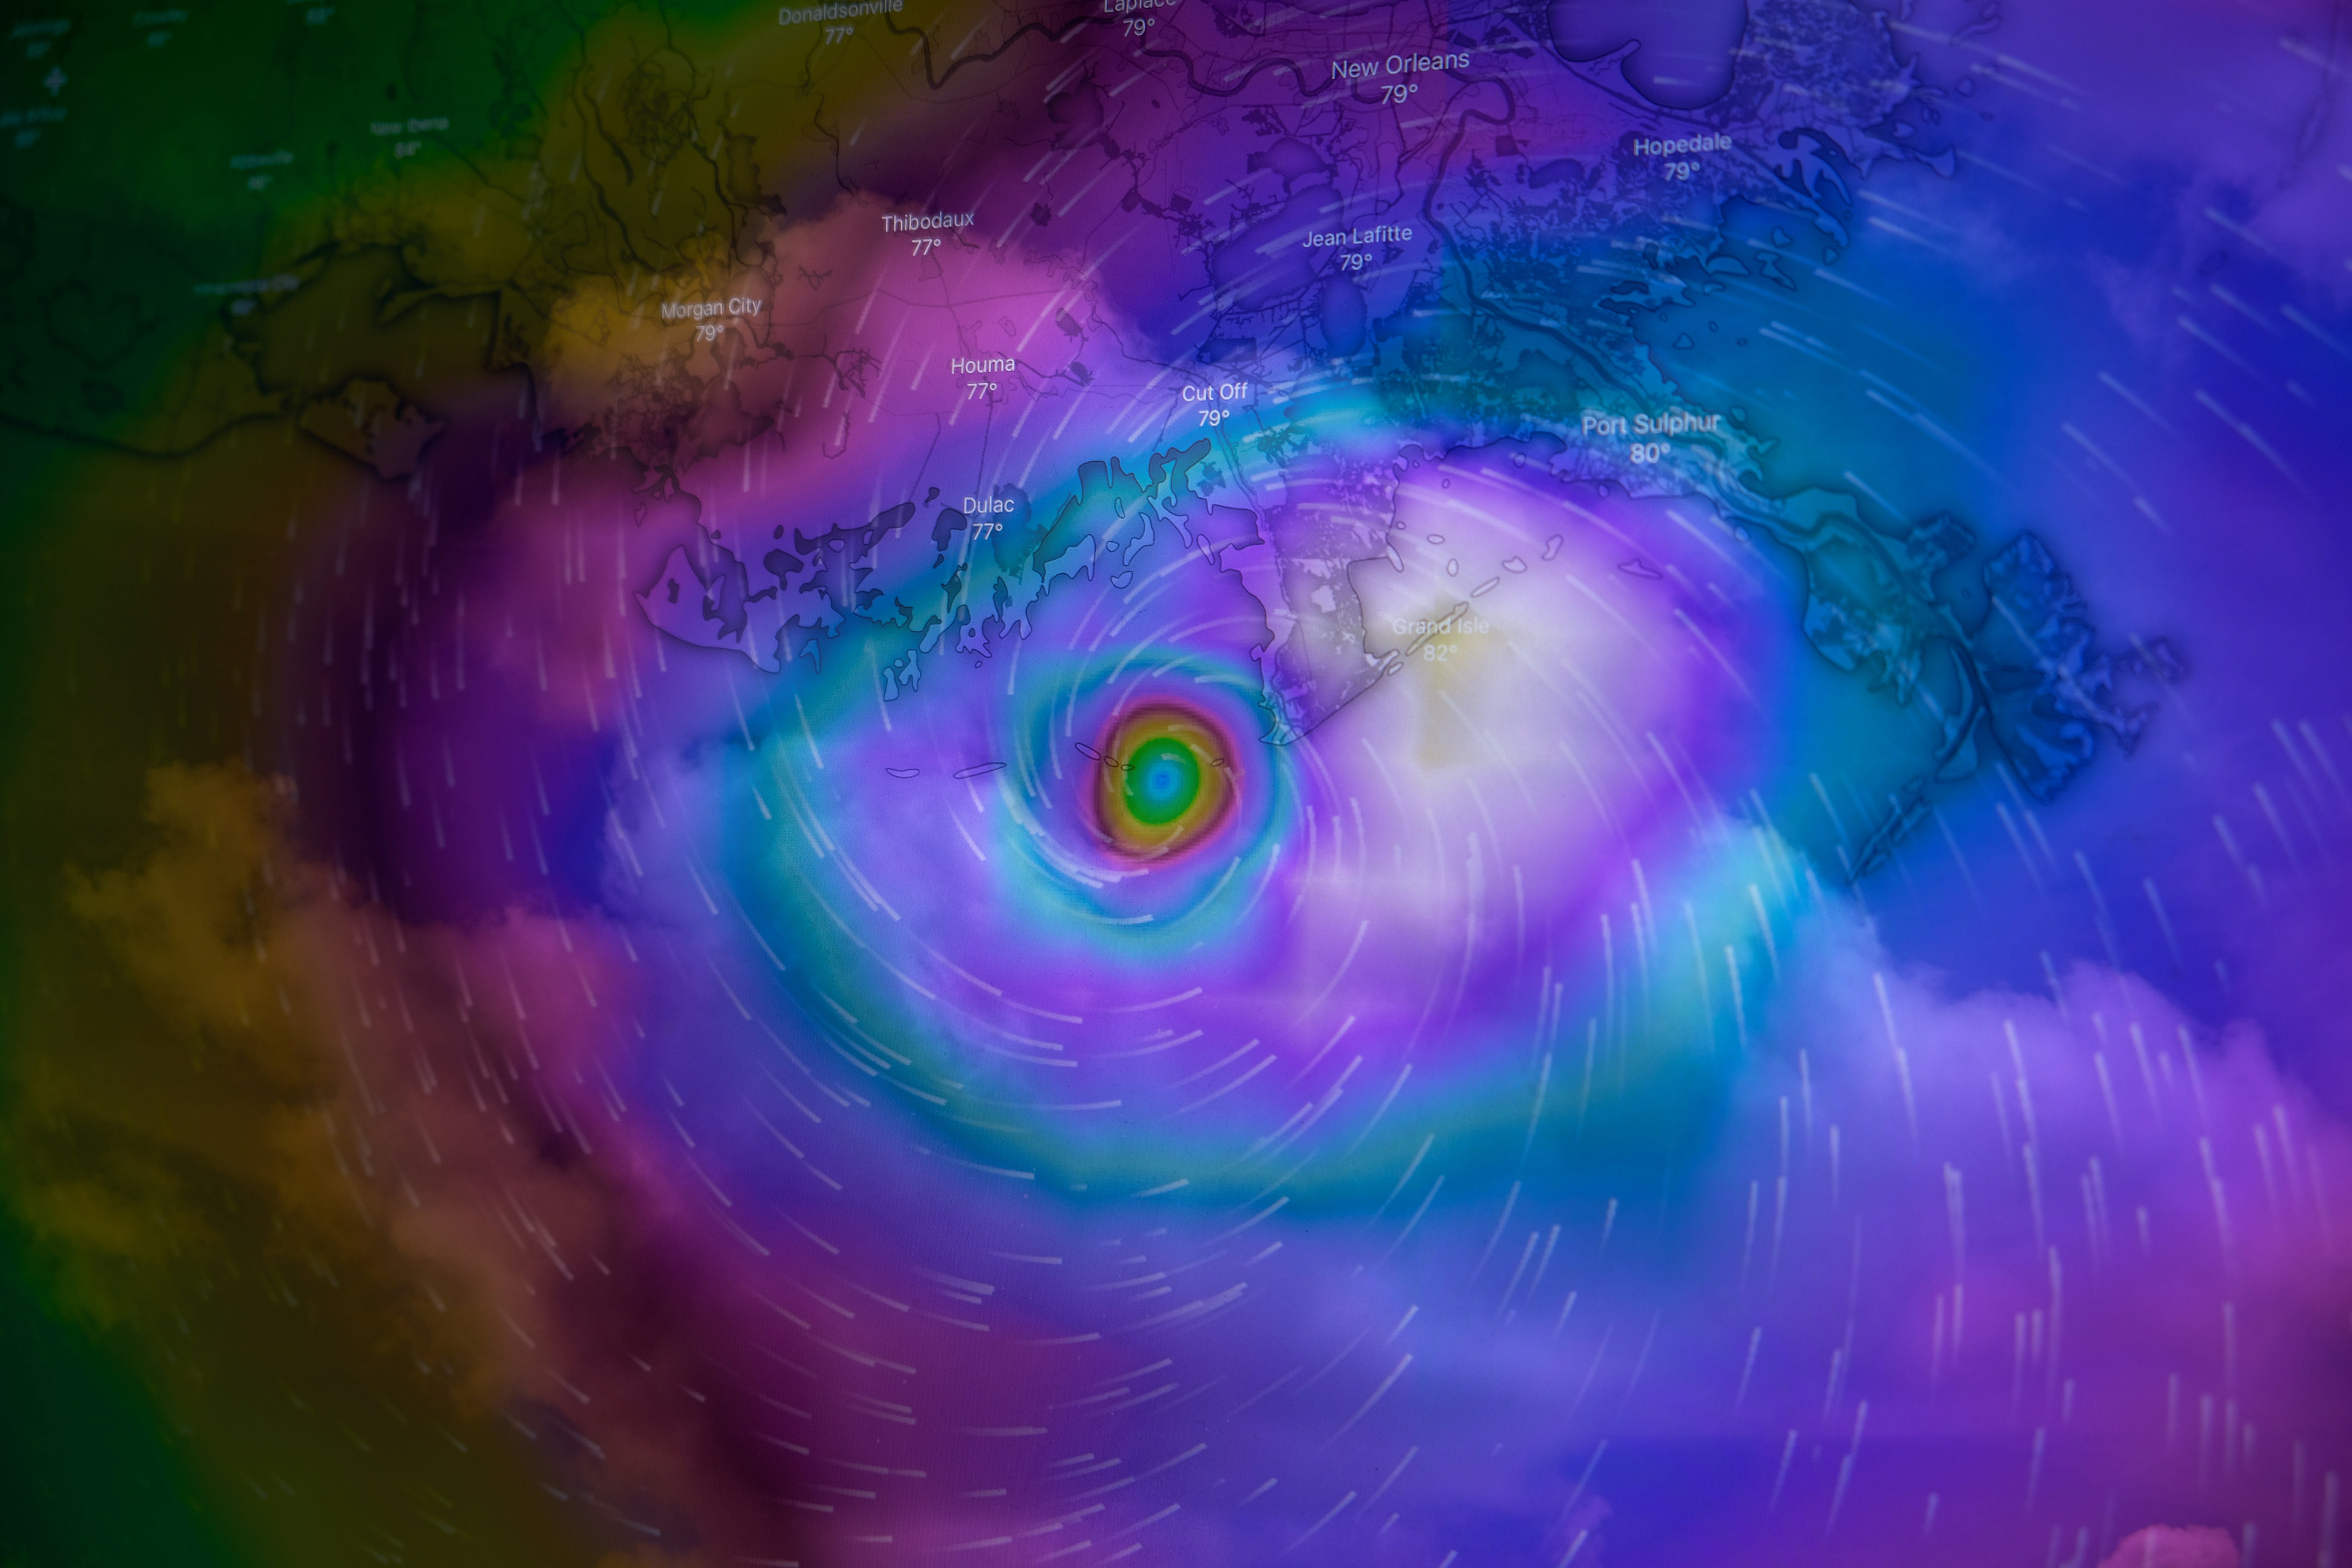
See the pattern the spreadsheet was hiding. Thematic mapping and remote sensing made legible to a non-specialist.

Web mapsGISRemote sensing

Dashboards & Decision Tools

Built for the question a decision-maker is actually facing, not built to showcase every dataset available.

DashboardsKPI trackingBriefings

Outreach & Advocacy

Get your data in front of the people who decide — investors, regulators, customers, the public.

Investor narrativesExplainersCampaigns

How we work

1

Scope

We define the one question your audience needs to walk away answering — before any tool gets chosen.

Typical engagement: 4–10 weeks.

2

Source

Data is audited, cleaned, and gaps are flagged early — not discovered halfway through design.

Engagement model: project-based, scoped after an initial call.

3

Shape

The right format gets built — dashboard, map, scrollytelling story — scoped to your timeline and budget.

Languages: English · French.

4

Ship

Delivered, documented, and handed off in a form your team can actually maintain.

We live-test the site with you at launch and stay reachable right after for troubleshooting. Final sign-off and legal clearance always rest with your team.

The Studio

Contour Lines is led by Yann Kerblat, a Paris-based information designer with over 15 years of experience, including seven years as a Disaster & Climate Resilience Analyst for the World Bank and the UN before founding the studio. He holds a Master’s in Data Visualization from Parsons School of Design and works in English and French. The studio works at the intersection of data, policy, and storytelling — helping organizations turn tangled, high-stakes data into interactive narratives that drive real-world decisions.

The Collective

Contour Lines operates as a collective. Depending on what a project demands, Yann draws on a network of specialized associates — data scientists, motion and interactive designers, photogrammetry and computer vision specialists, technical videographers, AI engineers, graphic designers — assembled around the scope of each engagement.

Our Philosophy

Behind every number is a landscape of trade-offs, risks, and human consequence. Design, to us, isn’t decoration for evidence — it’s what gives that evidence enough clarity that it can’t be ignored.

0

Years in disaster & climate data

0

Countries mapped

0

Institutional partners

Have a data communication challenge?

Let’s give it shape. Send a few details and we’ll get back to you.

Studio

Métro: Villiers or Rome
Arrondissement: XVII
Paris, France

Transmission

Secure envelope: yann@contourlines.studio

Status

Checking…

Languages

EN (bilingual) · FR (native)

Yann Kerblat

Founder, Contour Lines

Data Visualization × Digital Cartography Studio

Design isn’t decoration for evidence. It’s what gives evidence enough clarity that it can’t be ignored.
— The studio philosophy